:max_bytes(150000):strip_icc()/IntelinairScreenshots-a69a0a8c4cd2432baef9045a4a4c4816.jpg)
In a season of tight margins, every dollar counts, and every decision carries weight for the season’s outcome. “In a year with lower commodity prices, we have to really protect our crop, and we have to capitalize on everything that we can do to maximize yields,” says Bryan McMurtrie, a regional sales manager with Taranis.
One decision farmers grapple with every season is whether to apply a fungicide and the ideal application timing. It’s a balancing act to minimize disease damage while providing residual protection during critical plant stages that impact yield and plant health. Digital scouting platforms, such as Taranis, as well as Climate FieldView and Intelinair, offer tools to proactively manage crop diseases.
Climate FieldView
FieldView provides satellite imagery that can help identify potential issues such as crop disease. Generated from vegetation images, scouting images are displayed on a five-color scale, easily identifying areas with the most and least biomass.
“Green doesn’t always mean good and red doesn’t always mean bad,” says Andy Folta, U.S. product marketing manager for FieldView. “Red just indicates less green and is the place to prioritize scouting. For example, if a field went from 2% low biomass to 3.4% low biomass from one image to the next, we'll send an in-app or email push saying this field had a really big change in biomass. There might be a reason that you or a trusted advisor should scout to see what's happening in the field.”
Josh Curry raises corn, soybeans, wheat, and hay and also raises cattle and hogs near Alpha, Illinois, south of Moline. “Those maps are fun because you can scroll through all your acres, whether it’s 200 acres or 2,000,” says Curry, who has used FieldView for seven years. “You can pinpoint fields that need attention and talk to your agronomist you work with, or go yourself.”
FieldView allows the grower to share information with a trusted advisor such as a dealer, crop scout, or agronomist.
Farmers can choose from three subscription options: prime (free), plus, and premium. With prime, you can map fields, as well as manually import data and weather information. Plus ($299/year) adds field health imagery, FieldView Cab app connectivity, image-enhanced scouting, FieldView reports, and yield analysis. Top-tier premium ($799/year) includes unlimited Fieldview seed scripts, the platform’s enhanced scripting, and personalized insights.
:max_bytes(150000):strip_icc()/FieldViewscreenshotfieldhealth-89bc780b60e4481a8e8b19d74bf436fe.png)
Intelinair
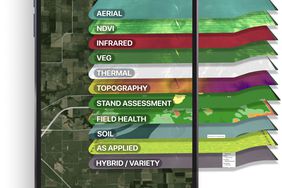
Intelinair's AGMRI platform uses machine learning, computer vision, and high-resolution imagery to construct a digital twin of the field. AGMRI takes data gathered by satellites, drones, and aircraft and uses machine-learning algorithms to produce multiple vegetative health indices. Those can detect crop emergence, diseases, weeds, and more.
In midseason, AGMRI uses thermal imagery to probe fields for elevated heat patterns, potential disease pressure indicators. “It's measuring that canopy temperature and when disease is starting to set in, that crop is raising its temperature by a couple degrees to fight off that disease,” explains Kevin Krieg, director of business development.
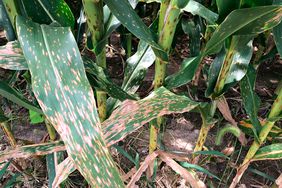
When an alert is triggered, users are guided to scout possible disease pressure locations. In an example Krieg shared, the thermal map used AGMRI to flag as a potential disease risk an otherwise healthy-looking field displaying an abnormally hot area. Scouting revealed early signs of gray leaf spot. “The alert detected the disease a week or so earlier and may have been missed if AGMRI was not used to identify the stress,” Kreig explains.
The grower applied a fungicide before yield was severely impacted.
AGMRI per-acre subscriptions include imagery throughout the crop season; timely AGMRI in-season and postseason insights and analytics; machine integrations; scouting; and access via iOS, tablet, or web.
Taranis
Taranis uses satellites, planes, and drones to capture field images down to the leaf level. Submillimeter resolution enables spotting differences between insect damage, nutrient deficiencies, weed species, and diseases at any growth stage.
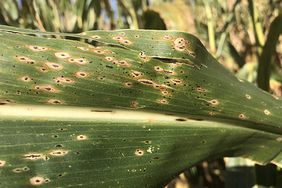
“With diseases, we're able to detect and identify what that lesion is on a corn leaf: gray leaf spot, northern corn leaf blight, rust, etc. and white mold in soybeans,” says the company’s Bryan McMurtrie. “It’s a very high-resolution image that the artificial intelligence is processing to identify those things, even through the canopy. We’re able to identify specific broadleaf and grass weeds, at dirt level through a tasseled corn crop.”
Taranis offers several per-acre subscription layers — essential, advanced, and pro — differing mainly in the number of flights. Essential offers three flights (early-season assessments), advanced offers an additional mid-season flight, and pro gives six flights throughout the season, from emergence to reproductive stages. “The cost of services can be covered with the equivalent of a few bushels of corn, or a bushel and a half of soybeans,” McMurtrie says.
:max_bytes(150000):strip_icc()/Taranisscreenshotinsectpressure-e6351970ada74add975a39f461e765b6.png)
Return on investment
With increased pressure from low commodity prices, it’s important for farmers to get out of their fields what they put into them.
“If we're really trying to watch our spending but we start to see a nutrient deficiency, Taranis can identify the deficiency, and allows time for a rescue micronutrient application and boosts your yield,” McMurtrie says. “In a year like this, it's almost like an insurance policy because without really knowing what's going on out there, how can we maximize our yields?”
Yield response, commodity prices, and cost of fungicide and application all determine whether an application is profitable. “With diseases, we have to be proactive,” says Nathan Klezewski, technical agronomist with Growmark. “Just because you have conditions that trigger an alert, conditions have to stay in that conducive window for a prolonged period of time to allow that disease to build and grow and cause yield loss. It depends on timing of the disease, severity, and application timing of the fungicide. That is why standard applications most often are the “best” for managing foliar diseases- because they protect the crop during a period that makes sound agronomic sense.”
“There’s a lot of variables there, and every field is different,” says Curry, the Illinois farmer. “It’s more than just the cost of the fungicide and the value of the corn. Sometimes there’s value in having standability or staying green.”
Curry says variety selection would also factor into the decision. “We had three varieties in a 300-acre field,” he recalls. “One was susceptible to diseases and responded to the fungicide application. One was more resistant to disease and didn’t need a fungicide application as much.”
Darcy Telenko, a Purdue University Extension plant pathologist, encourages farmers to make informed decisions and use all the tools available. Apps such as TarSpotter (tar spot), Sporecaster, and Sporebuster (white mold), as well as the corn ipmPIPE maps that track tar spot and southern rust, can all be useful to determine risk.
“In a low-disease risk, the potential yield benefit from a fungicide application may only be 2 or 3 bushels per acre,” she says. “When you have severe-disease risk, such as with tar spot, I’ve seen anywhere from 18- to 40-bushel net protection from a fungicide versus not.”
Insurance is another factor to consider, says Growmark’s Klezewski: “How much is the crop insured for? Is the cost of the fungicide going to be worth what I would have gotten by not spraying and just taking the insurance, or will the yield gained be worth it based on the five-year average?”
Data gathered throughout the season can guide decisions that ultimately affect return on investment (ROI). Emergence data can factor into mid- and late-season decisions as well. “Fields that have good emergence have a high yield potential, so farmers can invest in those fields where there is a solid foundation for yield,” explains Intelinair’s Krieg. “For fields with average emergence, I'll probably go with my standard plan. Those fields that are below average, I need to diagnose and figure out what's going on to prevent that from happening again.”
Scripting capabilities
FieldView enables farmers to generate prescriptions from imagery maps. “Users have the capability to generate zones based on those field health imagery maps," says the company's Folta. “They can then assign rates to the zones and export them as a prescription.”
Fieldview can connect with the John Deere Operations Center and Precision Planting's Panorama system, and can link cloud-to-cloud with Claas equipment (CLAAS TELEMATICS) and Ag Leader's AgFiniti + SMS Connect platform, as well as others.
AGMRI also can wirelessly export custom prescriptions to machinery in the field, connecting big-picture insights to day-to-day farmwork. AGMRI can sync with Climate FieldView, the John Deere Operations Center, Case IH AFS Connect, and New Holland PLM Connect.
Taranis is not fully integrated with platforms such as John Deere Operations Center or Climate FieldView. However, a subscriber can pull in planted maps, applied maps, and yield maps, and layer them over maps in the Taranis system. “One of the more important things we need to get started is field boundaries,” the company’s McMurtrie says. “You are able to pull field boundaries from these systems and add them to our system.”
Farmers also can set up prescriptions in the John Deere Operations Center to adjust rates based on input from digital scouting tools. Product mixes can keep records of what was applied in a field, based on the scouting recommendations.
Work Planner within the John Deere Operations Center can connect to machines. “Farmers can choose their fields, boundaries, guidance lines, product mix, rate, and if there is a prescription, they can pull that in and it would use the prescription as the rate,” says Ryan Stien, John Deere’s go-to-market digital technology manager.
“Then,” Stien continues, “farmers can deploy a work plan wirelessly to a specific piece of equipment connected to JDLink to execute a job in a specific or multiple fields. As soon as you enter a field boundary that’s set up, the work plan will automatically load all the information provided for the field, and you’re ready to go.”
:max_bytes(150000):strip_icc()/JohnDeereWorkPlannerImage-ec0d293f953640feadadb084939c6776.png)
:max_bytes(150000):strip_icc()/AdrienneHeld4x5crop-a7e3515671bc41c28273a85982f2c67e.jpg)
